Time Series Forecasting
Contents
Live Notebook
You can run this notebook in a live session ![]() or view it on Github.
or view it on Github.
Time Series Forecasting
This example shows using Prophet and Dask for scalable time series forecasting.
Prophet is a procedure for forecasting time series data based on an additive model where non-linear trends are fit with yearly, weekly, and daily seasonality, plus holiday effects.
As discussed in the Forecasting at scale, large datasets aren’t the only type of scaling challenge teams run into. In this example we’ll focus on the third type of scaling challenege indentified in that paper:
[I]n most realistic settings, a large number of forecasts will be created, necessitating efficient, automated means of evaluating and comparing them, as well as detecting when they are likely to be performing poorly. When hundreds or even thousands of forecasts are made, it becomes important to let machines do the hard work of model evaluation and comparison while efficiently using human feedback to fix performance problems.
That sounds like a perfect opportunity for Dask. We’ll use Prophet and Dask together to parallize the diagnostics stage of research. It does not attempt to parallize the training of the model itself.
[1]:
import pandas as pd
from prophet import Prophet
Importing plotly failed. Interactive plots will not work.
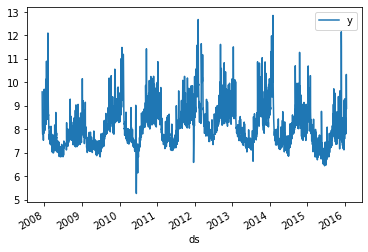
We’ll walk through the example from the Prophet quickstart. These values represent the log daily page views for Peyton Manning’s wikipedia page.
[2]:
df = pd.read_csv(
    'https://raw.githubusercontent.com/facebook/prophet/master/examples/example_wp_log_peyton_manning.csv',
    parse_dates=['ds']
)
df.head()
[2]:
| ds | y | |
|---|---|---|
| 0 | 2007-12-10 | 9.590761 |
| 1 | 2007-12-11 | 8.519590 |
| 2 | 2007-12-12 | 8.183677 |
| 3 | 2007-12-13 | 8.072467 |
| 4 | 2007-12-14 | 7.893572 |
[3]:
df.plot(x='ds', y='y');
Fitting the model takes a handful of seconds. Dask isn’t involved at all here.
[4]:
%%time
m = Prophet(daily_seasonality=False)
m.fit(df)
/usr/share/miniconda3/envs/dask-examples/lib/python3.9/site-packages/prophet/forecaster.py:896: FutureWarning: The frame.append method is deprecated and will be removed from pandas in a future version. Use pandas.concat instead.
  components = components.append(new_comp)
CPU times: user 2.46 s, sys: 108 ms, total: 2.56 s
Wall time: 2.61 s
[4]:
<prophet.forecaster.Prophet at 0x7f73c3efc9d0>
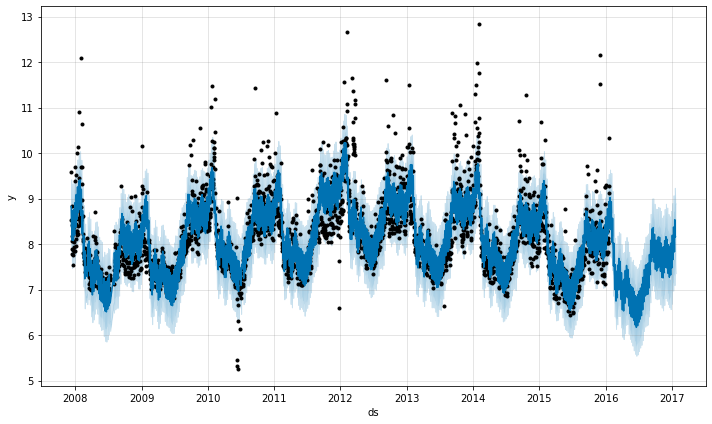
And we can make a forecast. Again, Dask isn’t involved here.
[5]:
future = m.make_future_dataframe(periods=365)
forecast = m.predict(future)
m.plot(forecast);
/usr/share/miniconda3/envs/dask-examples/lib/python3.9/site-packages/prophet/forecaster.py:896: FutureWarning: The frame.append method is deprecated and will be removed from pandas in a future version. Use pandas.concat instead.
  components = components.append(new_comp)
/usr/share/miniconda3/envs/dask-examples/lib/python3.9/site-packages/prophet/forecaster.py:896: FutureWarning: The frame.append method is deprecated and will be removed from pandas in a future version. Use pandas.concat instead.
  components = components.append(new_comp)
Parallel Diagnostics
Prophet includes a prophet.diagnostics.cross_validation function method, which uses simulated historical forecasts to provide some idea of a model’s quality.
This is done by selecting cutoff points in the history, and for each of them fitting the model using data only up to that cutoff point. We can then compare the forecasted values to the actual values.
See https://facebook.github.io/prophet/docs/diagnostics.html for more.
Internally, cross_validation generates a list of cutoff values to try. Prophet fits a model and computes some metrics for each of these. By default each model is fit sequentially, but the models can be trained in parallel using the parallel= keyword. On a single machine parallel="processes" is a good choice. For large problems where you’d like to distribute the work on a cluster, use parallel="dask" after you’ve connected to the cluster by creating a Client.
[6]:
import dask
from distributed import Client, performance_report
import prophet.diagnostics

client = Client(threads_per_worker=1)
client
[6]:
Client
Client-97840748-0de0-11ed-9f87-000d3a8f7959
| Connection method: Cluster object | Cluster type: distributed.LocalCluster |
| Dashboard: http://127.0.0.1:8787/status |
Cluster Info
LocalCluster
c05d4eee
| Dashboard: http://127.0.0.1:8787/status | Workers: 2 |
| Total threads: 2 | Total memory: 6.78 GiB |
| Status: running | Using processes: True |
Scheduler Info
Scheduler
Scheduler-e9054925-07ca-4262-a860-0ebc0723bd70
| Comm: tcp://127.0.0.1:44751 | Workers: 2 |
| Dashboard: http://127.0.0.1:8787/status | Total threads: 2 |
| Started: Just now | Total memory: 6.78 GiB |
Workers
Worker: 0
| Comm: tcp://127.0.0.1:34575 | Total threads: 1 |
| Dashboard: http://127.0.0.1:39267/status | Memory: 3.39 GiB |
| Nanny: tcp://127.0.0.1:39955 | |
| Local directory: /home/runner/work/dask-examples/dask-examples/applications/dask-worker-space/worker-toj_a9te | |
Worker: 1
| Comm: tcp://127.0.0.1:35829 | Total threads: 1 |
| Dashboard: http://127.0.0.1:34391/status | Memory: 3.39 GiB |
| Nanny: tcp://127.0.0.1:43645 | |
| Local directory: /home/runner/work/dask-examples/dask-examples/applications/dask-worker-space/worker-1yf153x7 | |
[7]:
%%time
df_cv = prophet.diagnostics.cross_validation(
    m, initial="730 days", period="180 days", horizon="365 days",
    parallel="dask"
)
INFO:prophet:Making 11 forecasts with cutoffs between 2010-02-15 00:00:00 and 2015-01-20 00:00:00
INFO:prophet:Applying in parallel with <Client: 'tcp://127.0.0.1:44751' processes=2 threads=2, memory=6.78 GiB>
CPU times: user 868 ms, sys: 122 ms, total: 990 ms
Wall time: 27.5 s
Be sure to watch the Dask Dashboard as that runs. The models are fit in parallel on the cluster. At the start there’s bit of overhead from having to move the model and data to the workers but after that the scaling looks quite nice.